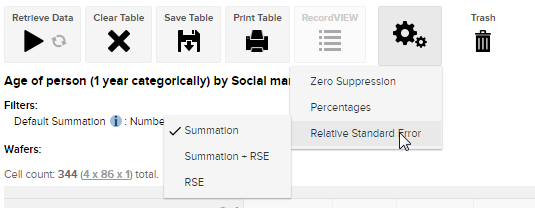
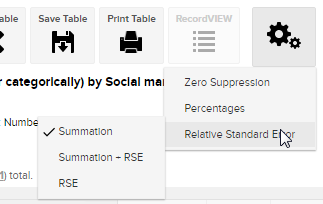
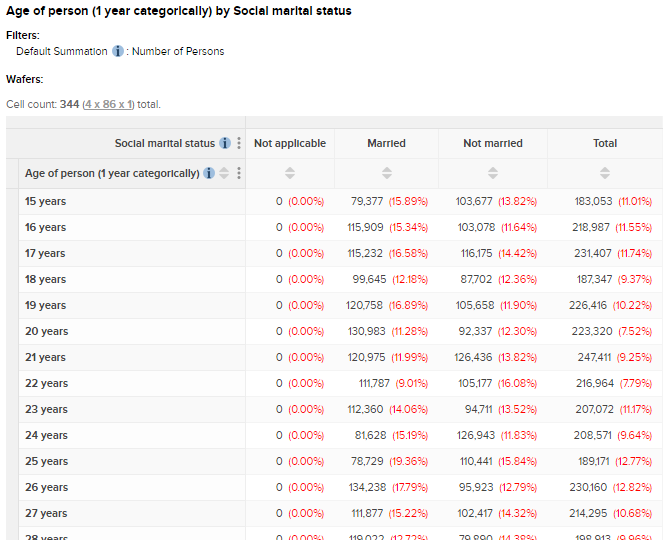
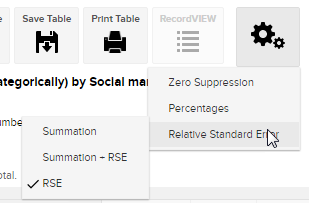
Depending on the data you are working with, you may have access to the Relative Standard Error (RSE) options in the menu at the top of Table View:
These options let you view the RSE figures for the current table. RSE is only available if the dataset is weighted (for example a sample survey that has been weighted to cover the entire population).
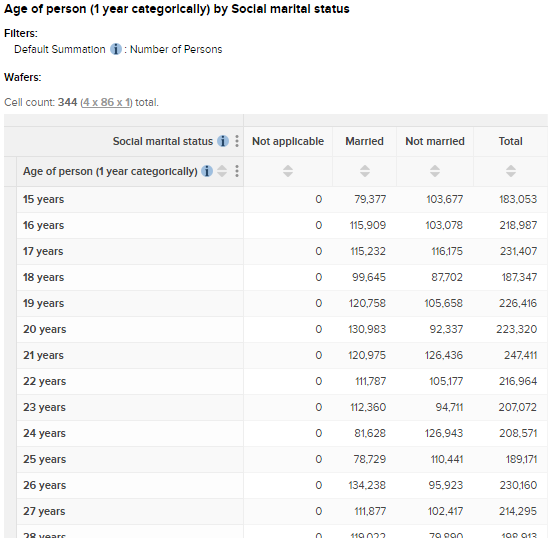
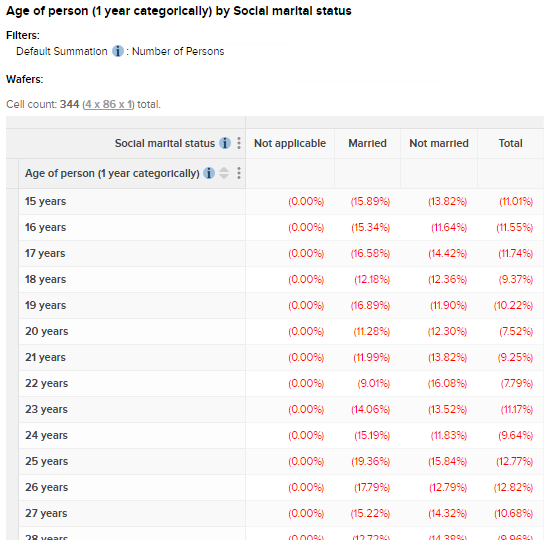
If your system uses the RSE feature, then your administrator can configure what you see by default. Depending on how your administrator has configured it, when you run a cross tabulation you may initially see the summation values alone, or the RSE values alone, or a combination of both.
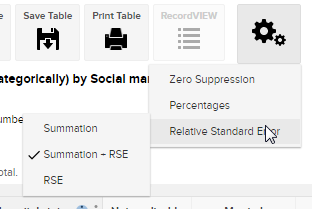
You can choose a different view by selecting an option from the menu:

